Experimentation3 min read
How to Run a Proper A/B Test
Tests are hard and people are bad at them. Learn how to be better at running A/B tests.

Gregory Schnese
Director of Demand Generation, FMX
“Let’s just run a test.” — every startup ever
Testing gets thrown around a lot at companies, but many people don’t appreciate what are good test candidates and how much time is required to run a proper test.
What is an A/B test?
In simple terms, an A/B test is used to see how a change impacts a metric. If we change our signup button from green to blue, how does that impact our signup rate? By using two (A or B) or more groups, any extraneous influences (news, seasonality, etc.) will impact both groups equally so we can focus only on the change we introduce. We isolate our change so it is the only difference between the groups. This way, we can be confident the change in metrics is due to our effort.
First A/B test
To run a proper A/B test we need to anticipate what we expect the impact to be, calculate our required sample size, and then see if the results are statistically significant. Sample size and statistical significance are important because we want to make sure the change in a metric is caused by our actions and not something else.
In general, the larger the impact of a test, the smaller the required sample size. This is just a fancy way of saying when we have lower amounts of traffic, we want to see bigger changes in our tests. Think of improving our metric by 30% or more, not by 5%. With low traffic, we need big wins to finish a test within an acceptable amount of time.
People are bad at A/B tests
People generally underestimate the amount of traffic (time) required to generate a proper sample size.
According to abtasty.com we would need 30,244 people per test group (60,488 in total) to detect a 10% change, with 95% statistical significance, given a 5% starting conversion rate:
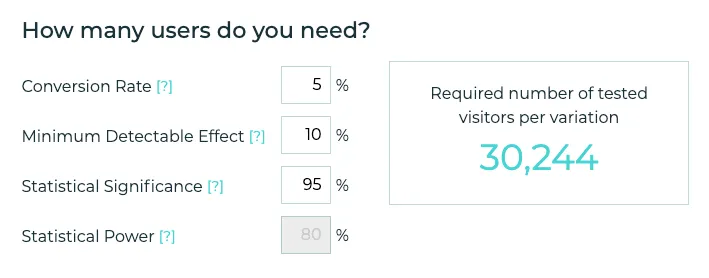
How long does it take to generate over 60k unique visitors? Probably too long…
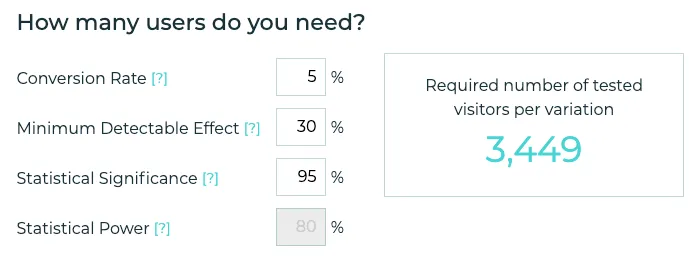
To detect a 30% lift, we would only need 3,449 people per group or 6,898 in total.
What does this mean on a day-to-day basis for a growth marketer? When our traffic for a test is low, we want the outcome to be dramatic. We want to target improvements 30% or higher. We need to have some reason to think our test could deliver a gain like this. If it can’t, we need to think of a new idea.
Since your startup has less traffic, that means test duration is inherently longer. Making small changes (like moving a button) compounds that issue since it’s a small relative change on a small sample size. Resolving a test with 5% lift could take months. That’s useless.
— Andy Johns (@ibringtraffic), January 10, 2020
A proper A/B test

Let’s say we want to increase the View Homepage → Newsletter Signup rate for this site. The above example (control on the left, test on the right) would be a good test to run. The anticipated change is large so the overall sample size is relatively small:
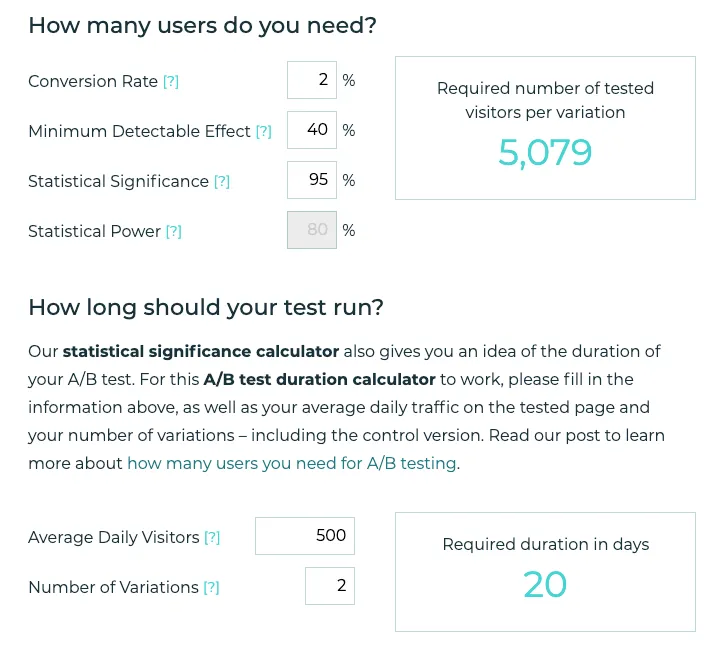
Assuming we want to increase the Newsletter Signup rate by 40%, with 500 visitors per day, we could run this test for 20 days. This sounds reasonable.
Statistical significance
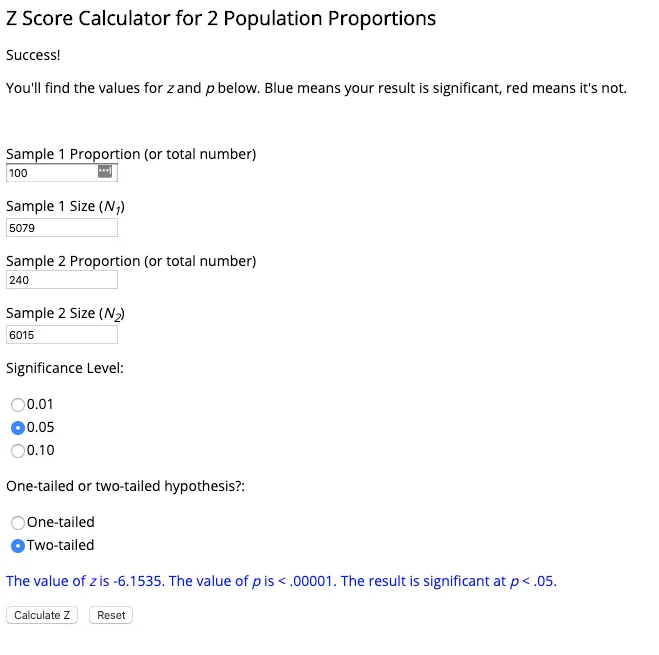
After 20 days, we plug our numbers into a statistical significance calculator (above).
In our example, we can see our test version won and we have 95% confidence the change is due to our efforts and not chance.
What happens when the results are not statistically significant?
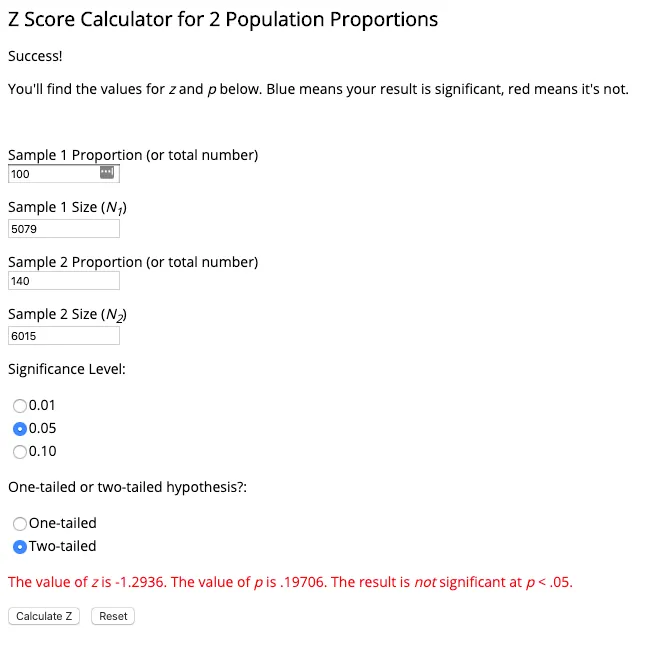
While a successful test is great, we sometimes find ourselves in this gray area where we haven’t reached statistical significance. In other words, we can’t tell if the change is actually due to our efforts or something else. To address this, we can allow the test to continue to collect data, accept the test, or reject the test. When possible, I like to continue to collect data as statistical significance is important to me; it’s like setting a solid foundation to build upon. Each situation and team will be different here.
Feel free to reach out with any questions. I’d love to hear about your success with A/B tests!